What America's Lawyers Earn
It’s no secret that the business of practicing law has changed—and continues to change—in ways that are both subtle and dramatic.
We’ve covered that transformation over the years in these pages: technology-driven efficiencies, niche practices developed around social change, new challenges to the profession dictated by both gut-wrenching recession and fundamental industrial change.
Read all the articles in our special report:
But while our reporting on this metamorphosis has been solid, even at times prophetic, it’s been based in great part on the tools of journalism: anecdote, instinct and the oft-competing wisdom of any experts we can find.
With this issue, however, the ABA Journal is offering our readers a new—and we believe different—view of the business and the profession.
We've teamed up with a nationally recognized expert on trends in the legal profession, William D. Henderson of the Center on the Global Legal Profession at Indiana University's Maurer School of Law. We asked Henderson, a pioneer in the empirical study of the legal industry, to identify and map the movements of jobs and money.
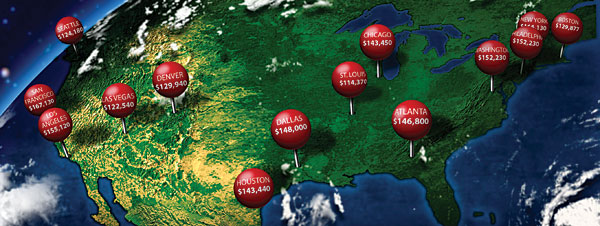
Illustration by Stephen Ravenscraft
Using a variety of government statistics detailed later in these pages, Henderson and the ABA Journal have undertaken a study of the business of law that attempts to define some of the important long-term changes in the industry and to identify the influences that are propelling them.
In this, the first installment of a periodic series, we look at the geography of lawyer salaries, showing where the jobs are and what they pay. Using actual salary data reported to the U.S. Bureau of Labor Statistics on employed lawyers—whether they are associates or government attorneys or corporate counsel—we've mapped out average lawyer pay by county. We've also defined the top 35 legal markets, which soak up two-thirds of the jobs and 75 percent of the payroll. And we've identified 10 smaller markets whose average salary figures may surprise you—lesser law markets that are paying big-city bucks.

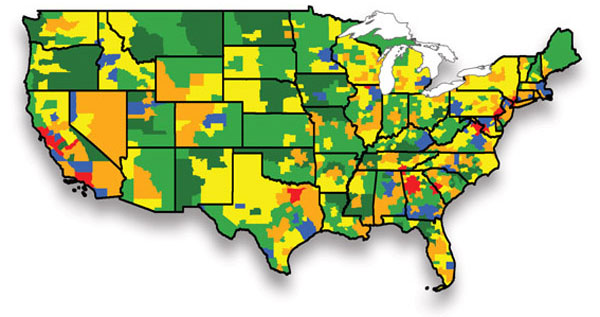
Click the image above to search for detailed numbers for your county.
Like any statistics, these salary figures often vary from anecdotal experience. And because they represent payroll data, they don't include equity partners or solos. But they do represent the best estimates we can glean from the most current BLS data as of mid-2009.
And be sure to check out our detailed tables, as well as an interactive application that allows you to retrieve statistics for your area.
While it is hard for many lawyers to think of themselves as part of an industry as well as a profession, we feel that this new view of the legal environment—a kind of business-by-the-numbers—will give our readers one more tool to help them understand and cope with the transformational era that is upon us, whether we are ready or not.

AVERAGE LAWYER SALARIES
This map shows a range of mean (average) lawyer salaries for virtually every market in the United States. The statistics underlying the map represent the latest data available from the Bureau of Labor Statistics in its May 2009 Occupational Employment Statistics survey.
Note: Alaska's average lawyer salary is $104,970. Hawaii's lawyers average $94,830.

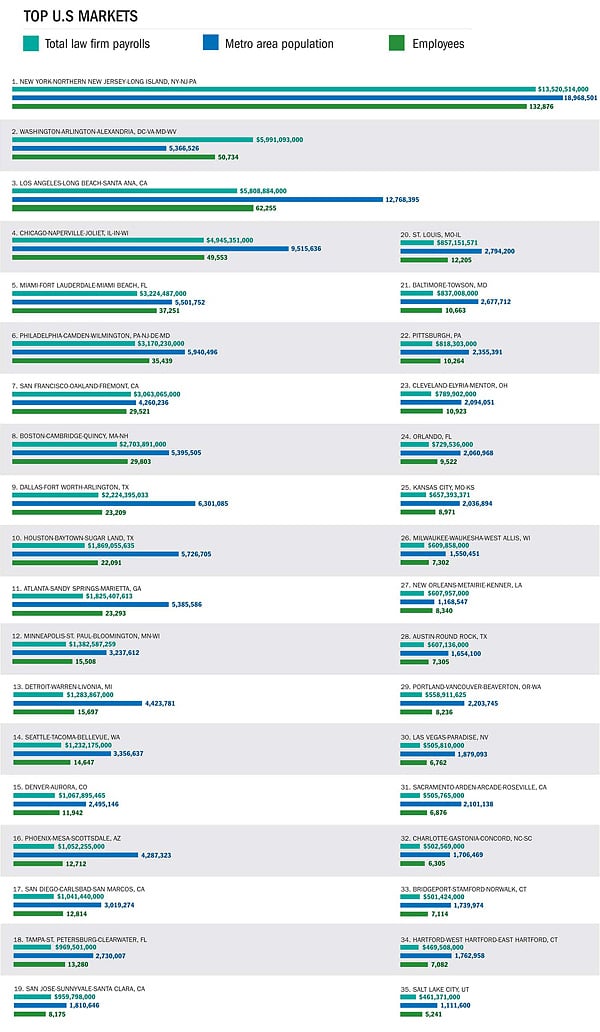
WHERE LAW FIRM PAYROLLS ARE LARGEST
This table ranks legal markets by law firm salaries, as measured by the U.S. Census Bureau in its county business patterns dataset, which includes all employers with paid employees in the United States. Total payroll represents gross annual salaries paid by law firms in each market to anyone—lawyers, paralegals, secretaries, court reporters, investigators, etc.—who receives a regular paycheck from a law firm. Metro area population is the 2009 census estimate.
WHERE LAWYERS EARN THE MOST |
|||||
| Metro market (more than 400 lawyers) | Mean wage | Lawyers | Public companies | Law schools | |
1 |
San Jose-Sunnyvale-Santa Clara CA | $192,020.00 | 4,130 | 189 | 2 |
2 |
San Francisco-San Mateo-Redwood City CA | $167,130.00 | 9,790 | 149 | 3 |
3 |
New York-White Plains-Wayne NY-NJ | $166,130.00 | 51,580 | 580 | 9 |
4 |
Santa Ana-Anaheim-Irvine CA | $157,950.00 | 6,380 | 206 | 2 |
5 |
Los Angeles-Long Beach-Glendale CA | $155,120.00 | 25,350 | 359 | 4 |
6 |
Modesto CA | $153,540.00 | 530 | 1 | 0 |
7 |
Wilmington DE-MD-NJ | $153,520.00 | 2,120 | 25 | 1 |
8 |
Washington DC-MD-VA | $152,230.00 | 37,970 | 146 | 7 |
9 |
Oxnard-Thousand Oaks-Ventura CA | $150,850.00 | 1,000 | 31 | 1 |
10 |
Chattanooga TN-GA | $148,350.00 | 710 | 10 | 0 |
11 |
Dallas-Plano-Irving TX | $148,000.00 | 8,800 | 205 | 2 |
12 |
Atlanta-Sandy Springs-Marietta GA | $146,800.00 | 11,630 | 142 | 2 |
13 |
Oakland-Fremont-Hayward CA | $145,620.00 | 3,960 | 92 | 1 |
14 |
Philadelphia PA | $145,160.00 | 12,000 | 161 | 3 |
15 |
Chicago-Naperville-Joliet IL | $143,450.00 | 24,620 | 198 | 7 |
16 |
Houston-Sugar Land-Baytown TX | $143,440.00 | 9,550 | 312 | 3 |
17 |
San Diego-Carlsbad-San Marcos CA | $143,300.00 | 5,670 | 172 | 3 |
18 |
Reno-Sparks NV | $136,930.00 | 740 | 36 | 0 |
19 |
Greensboro-High Point NC | $136,070.00 | 680 | 15 | 0 |
20 |
Minneapolis-St. Paul-Bloomington MN-WI | $135,390.00 | 8,230 | 135 | 4 |
21 |
Newark-Union NJ-PA | $132,520.00 | 7,320 | 74 | 2 |
22 |
Baltimore-Towson MD | $132,500.00 | 6,030 | 58 | 2 |
23 |
Bethesda-Frederick-Gaithersburg MD | $132,490.00 | 2,960 | 64 | 0 |
24 |
El Paso TX | $132,240.00 | 680 | 3 | 0 |
25 |
Birmingham-Hoover AL | $131,380.00 | 2,150 | 21 | 1 |
26 |
Boston-Cambridge-Quincy MA | $131,340.00 | 12,230 | 33 | 4 |
27 |
Charlotte-Gastonia-Concord NC-SC | $130,520.00 | 3,090 | 47 | 0 |
28 |
Richmond VA | $130,340.00 | 2,180 | 33 | 1 |
29 |
Denver-Aurora CO | $129,940.00 | 7,910 | 161 | 1 |
30 |
W. Palm Beach-Boca Raton-Boynton Beach FL | $128,810.00 | 3,550 | 69 | 0 |
31 |
Pittsburgh PA | $127,360.00 | 4,940 | 60 | 2 |
32 |
Warren-Troy-Farmington Hills MI | $126,450.00 | 5,450 | 53 | 0 |
33 |
Des Moines-West Des Moines IA | $126,220.00 | 1,390 | 9 | 1 |
34 |
Huntsville AL | $125,400.00 | 440 | 3 | 0 |
35 |
Salt Lake City UT | $125,010.00 | 3,360 | 78 | 1 |
A NOTE ON METHODOLOGY AND SOURCES
Except as noted in the table, the source of the underlying data for maps and tables is the U.S. Bureau of Labor Statistics' May 2009 Occupational Employment Statistics survey.
The BLS data are a representative sample of employed lawyers. The sample includes lawyers employed in law firms, state and local government, federal government, in-house lawyers in businesses, and nonprofits. Lawyers, as defined by the BLS classification (SOC), "represent clients in criminal and civil litigation and other legal proceedings, draw up legal documents, and manage or advise clients on legal transactions. May specialize in a single area or may practice broadly in many areas of law." Equity partners and solo practitioners are not included in the survey. The estimates for May 2009 are calculated using six semiannual panels collected over a three-year period: May 2009, November 2008, May 2008, November 2007, May 2007 and November 2006. The overall national response rate for the six panels is 78.2 percent based on establishments and 74.5 percent based on employment.
William D. Henderson is director of the Center on the Global Legal Profession, and professor of law and Nolan Faculty Fellow at Indiana University's Maurer School of Law. He received his JD from the University of Chicago in 2001. He was assisted by Jonathan Rinehart, a research fellow at the Center on the Global Legal Profession.
Correction
In the print version of the March cover feature "What America's Lawyers Earn," the chart of lawyer salaries on page 38 incorrectly separates data for the Washington, D.C., area into two entries, ranked as Nos. 4 and 13. When properly combined, the Washington-Arlington-Alexandria DC-VA-MD-WV metro area is ranked No. 2 with total law firm payroll of $5,991,093,000, total population of 5,366,526 and 50,734 employees. Another chart, "Where Lawyers Earn the Most," page 40 in the print version, should have included one law school for Richmond, Va.The Journal regrets the errors.