Metrics can tell the tale of a firm's fate

Illustration by Sam Ward
Take former Dewey & LeBoeuf finance director Frank Canellas. In late July, at a time when many law firm executives are planning trips to exotic locales or spending time in their summer homes, Canellas got to hang out in lovely downtown Manhattan. He spent a tense and emotional week on the witness stand in Manhattan Supreme Court, where he was tasked with pointing the finger at his former bosses while taking some not-so-friendly fire from their defense attorneys.
Canellas had the daunting task of explaining to jurors how allegedly illegal accounting adjustments and tricks were used to cover up the failed firm’s massive debt and lack of cash flow. Prosecutors with the Manhattan District Attorney’s Office were relying on Canellas to deliver the smoking gun that would convict former Dewey chairman Steven Davis, former executive director Stephen DiCarmine and ex-chief financial officer Joel Sanders of fraud, grand larceny and other crimes in connection with the firm’s implosion.
Didn’t happen.
Still, while the Dewey proceeding ended in mistrial and several not-guilty verdicts, there are plenty of lessons lawyers and law firms can learn from this financially complex case. Perhaps the most important one is that lawyers must be vigilant in monitoring the available evidence of their law firms’ overall fiscal health. Ask any of the several former Dewey partners, who testified to their surprise and regret when they found out that the firm’s financial optimism wasn’t based on cash in hand.
Luckily there are plenty of available metrics that can allow lawyers to more accurately decode the financial health of their firms. Indeed, these metrics have been there all along, hiding in plain sight.

The four Dewey defendants arrive in handcuffs for their arraignment at Manhattan Criminal Court in March 2014. Photograph by Carlo Allegri/Reuters.
Even better, these metrics don’t require a lawyer to double as a CPA, financial analyst or numbers whiz to get a better understanding of how the firm is performing. They are basic numbers law firms should already be reporting to partners on a continuing basis.
Here are four tools that will give lawyers some strong indicators about the overall fiscal health of their firms, as well as provide a platform for asking more specific questions of their firm leaders.
LINE OF CREDIT
Canellas spent much of his time on the stand testifying about how the firm’s debt impacted Dewey’s multimillion-dollar lines of credit. According to Canellas, the reason the firm had to rely on accounting tricks and adjustments was because it could not meet the cash flow covenants in its loan agreements.
The fact that Dewey had to borrow money was no big deal. “It’s common for firms to utilize lines of credit,” says Gretta Rusanow, head of advisory services for Citi Private Bank Law Firm Group. “Credit lines help firms smooth their cash flow throughout the year.”
A line of credit is relatively cheap money, and it can enable the firm to maintain partner distributions on a more regular basis or run its cash management closer to a zero balance, often for the purpose of enabling higher draws to partners during the year.
Lines of credit are also advantageous because they often contain covenants requiring firms to maintain a certain level of cash flow. Banks will typically only lend to law firms that have solid finances, good cash flow and a great reputation. However, law firms are starting to become less dependent on institutional loans, shifting the financing burden to partners by asking for more capital contributions.
“If you owe a lot of money to the bank, then there’s a lot you have to cover,” says Jim Cotterman, a principal at Altman Weil. “Banks will probably want monthly financial statements and [want to] see the accounts receivable in order to ensure that the loan is repaid. If you forgo that by relying on capital contributions, then your borrowing capacity is freed up for something else, like financing an important matter or responding to something unexpected.”
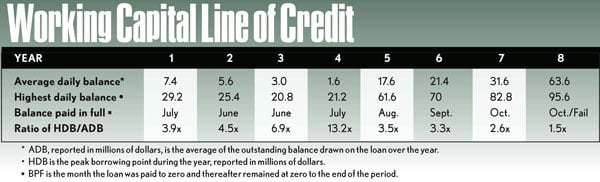
The stresses of a liquidity shortfall (inadequate cash) can be observed in watching the working capital line of credit closely over time. The chart below draws data from an actual failed law firm. The data has been adjusted to conceal the identity of the firm while accurately portraying the financial dynamic over eight years of its existence, with year eight being the last (and partial) year of failure.
On the chart, the average daily balance is simply the average of the outstanding balance drawn on the loan over the year. The highest daily balance is the peak borrowing point on the line during the year. The balance paid in full is the month the loan was paid to zero and thereafter remained at zero to the end of the year. The ratio of HDB/ADB is a multiple and shows how much larger the highest daily balance is than the average.
During the first three to four years, the firm appears to be doing well, and use of the revolving line of credit is falling. Note that while the ADB falls significantly through year four, the HDB does not move as significantly. Part of the reason is that, like most firms, this one drew heavily in January and February to cover its operating costs and partner draws.

“Credit lines help firms smooth their cash flow throughout the year.” —Gretta Rusanow. Photograph by Len Irish.
Note that the ratio of HDB to ADB provides a multiple of approximately four times or higher during the first four years. The higher the multiple the better, showing the outstanding loan balance was lower for a longer time. However, in years five through eight, there is a swing to a significantly increasing ADB, a jump in the HDB, a clear trend to pay off the revolving line later in the calendar year, and a falling multiple to below 4 until financial collapse.
This data was collected from a monthly report the firm maintained and easily compiled from the monthly bank statement.
There is a clear sign in year five that something changed dramatically in the firm’s financial performance and its reliance on debt. In fact, it was clear before the middle of year five that the situation was turning sharply down.
Because of successful years one through four, there were partner demands for stronger distributions. Though the firm’s cash flow from operations declined, the firm kept up with those distributions, driving loan balances higher and payoff dates later. Lack of leadership discipline over partner draw policies—and possibly lack of understanding of what was transpiring—combined with the hope that “things will get better,” helped move the firm to failure.
For this firm, a warning sign was when the HDB/ADB ratio fell below 4. There were at least 3½ years of advance warning and critical signs of instability two years in advance of the firm’s failure. At that point, every partner there would have been in a position to know from these figures that they had to do something while there was still time. Instead, this firm collapsed shortly after having what partners thought were their most successful years. At the end of every year, the revolving line of credit had zero balance, and the firm had told its partners: “We have no debt.”
The numbers show this wasn’t the case: The heavy use of debt merely masked the firm’s ills.
LIQUIDITY: WORKING CAPITAL RATIO
Most businesses, including law firms, do not fail for lack of profits. They fail for lack of cash.
Ralph Baxter knows all about how difficult it is for law firms to manage cash flow. The former chairman and CEO of Orrick, Herrington & Sutcliffe recalls that cash flow was something he constantly worried about.
“Lawyers are notoriously bad at even recording their time and submitting it,” Baxter says. “The best-case scenario is you get the bill out a month after you do the work, but a lot of firms aren’t even good about that. Then clients get the bill, and they might take time before paying it. So it’s a month or more before you even get the money—and that’s if everything goes smoothly.” (According to LexisNexis, the average law firm waits 83 days after bills are sent out to get paid.)
During his time in charge at Orrick, Baxter says, he kept track of general metrics relating to the firm’s liquidity—namely, ratio of equity to debt.
“Firms are very different when it comes to debt,” he says. “Some have no debt, and those firms will generally retain their earnings. Most firms have debt, though. If you go through a challenging time, then you have to watch all the details of your economic condition.”
Liquidity measures your cash and cash flows—what you have on hand to pay bills, make investments and distribute to partners. Liquidity indicates whether a firm may survive to the end of this period.
There are several quick measures to look at, one of which is the working capital ratio. The WCR is the excess of current assets over current liabilities, typically expressed as the number of times liabilities can be divided into assets. This computation should be made at the close of each month for a dynamic picture of the firm’s liquidity position throughout the year, and for comparability from year to year.
All we need for this test is the monthly statement of partner draws, collections, expenses paid, and draws on the working line of credit with balance outstanding.
In simplified fashion, let’s say our hypothetical law firm has $100 million in annual revenues ($8.33 million per month); an operating margin—or profit—of 36 percent of annual revenues, which are distributed at 55 percent of forecast to partners each month, plus a year-end distribution; no debt other than its revolving credit line; and $5 million in monthly operating expenses. (In addition to expenses, the firm has $4 million per year in capital outlays, making $64 million in annual outlays and $36 million coming in as distributable profit.)
The firm has a stabilized accounts receivable of 3½ months ($29.2 million), plus about $350,000 cash—or about $30 million. Using our WCR formula, the monthly ratio shows current assets that are six times current liabilities ($30 million versus $5 million). That sounds pretty great, except what about paying partners a draw? We need to include 55 percent of the forecast profits of $36 million, which is $19.8 million for the year, or $1.65 million monthly. Add that to the liabilities, and now WCR falls to 4½ times, about 22.2 percent.
But wait, there’s more: Law firms typically don’t show a consistent WCR because of the variability in partner distributions. For example, during the year it is common for AR to build up, and cash (possibly supplemented by debt drawn from the bank line of credit) is used to pay for operating expenses and (sometimes) partner draws. As this debt goes into the equation, the WCR falls.
The WCR on Dec. 31 will look the best of any time during the year because of the large pool of cash collected (year-end collections tend to be larger) but not yet paid to partners (that undistributed 45 percent of profits). But on Jan. 31 after partner distributions are made, the picture is very different. For our example firm, that will be $16.2 million in January distributions, reducing the current asset base, so the WCR drops to perhaps 2 or 3. If you want a better look at the firm liquidity, look at the Jan. 31 numbers.
Illustration by Sam Ward
LIQUIDITY: CASH FLOW
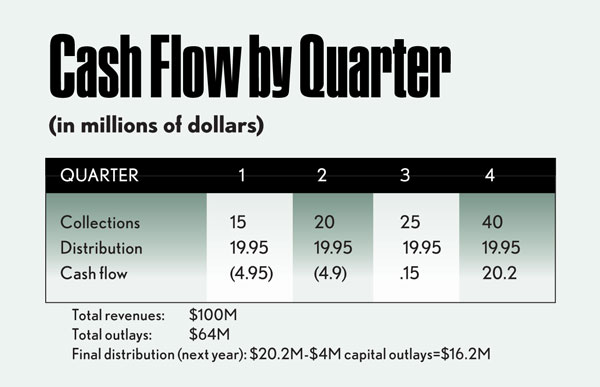
Let’s look at the cash flow for each quarter of the year and consider the usual variations in collections. (See chart above.)
As we start the new year, we experience first-quarter collections that are commonly only 60 percent of the annualized monthly rate of $8.33 million—$5 million a month, or $15 million for that quarter. With the quarterly distribution of $19.95 million ($5 million in expenses and $1.65 million of partner draws monthly for three months) we generate $4.95 million of negative cash flow in quarter one, an amount that just happens to be equal to partner distributions made on forecasts of profits. The simple truth is that the firm only earned enough to pay its bills for the first three months, and if it paid out actual profits to partners when they were collected, partners would have received zero compensation.
Quarter two collections are often about 80 percent of the average, or about $20 million, which is barely above the $19.95 million outflow. What this makes clear is that as of June 30, the firm is stabilized but still in the negative cumulatively by about $5 million.
Third-quarter collections are about average, or about $25 million, so our firm generates enough cash to get back to parity by the end of quarter three, including all costs and partner draws to date.
Now you get the eyes-wide-open picture of why the fourth-quarter collections push is so critical: All of the 45 percent of partner distribution—
$16.2 million—plus quarter four draws and the other expenses have to be collected then to make budget.
Then look at the dynamic of the working capital ratio over time: Is it—over the years and for comparable months year to year—worsening? Is the level of debt drawn in quarter one increasing overall—per lawyer, per partner? Is the date of loan payoff getting later?
Or subtract the balance sheet cash at the end of any given month from the outstanding balance. If there is still a debt balance, the firm is borrowing against future collection of accounts receivable to pay for distributions already passed out to partners—and possibly to pay creditors.
The cash flow pressure can be severe for most of the year, and a failure to renew the line of credit or the addition of certain financial performance covenants could reduce partner distributions and destroy the firm. That is so much of a threat that some law firms’ capital contributions made early in the year are the financial equivalent of partners paying partners with their own money. Indeed, in a law firm with very high capital-account requirements, the partner capital can serve the same role as the working line of credit from a bank. And that doesn’t mean the firm is stronger.
As such, it becomes extremely important for lawyers and law firms to collect money as quickly and efficiently as possible. To spur partners to send out in-voices quickly, Thorsten Zulauf says that when he was chief financial officer at Linklaters Germany he instituted a “sinner’s list,” naming the top 20 partners or practice areas that had the most in outstanding receivables. He also says that, before taking on a matter, the firm would do a detailed cost analysis and present the estimate to the client up front.

“Lawyers are notoriously bad at even recording their time and submitting it.” — Ralph Baxter. Photograph by Len Irish.
“This way the client doesn’t get a big surprise when the invoice comes,” says Zulauf. “Hopefully, that causes the client to pay the invoice promptly and without any comment.”
Jack Newton, CEO of Clio, which produces practice management software, cites what he calls a “client appreciation curve” to argue that law firms need tools to allow them to automate billing and collecting processes immediately after the work is completed.
“When you deliver your work product, the client appreciation curve is at max and will only decay from that,” Newton says. “We have concrete data that shows that when clients bill electronically, they get paid way faster than the average. It might even be same day.”
Michael McKenney, head of investment finance for Citi Private Bank’s Law Firm Group, goes even further, saying collections that take longer than 180 days raise a huge red flag. “When the inventory gets too aged, as in beyond 180 days,” McKenney says, “we’ve found that a firm’s ability to collect on it is not as good.”
PROFIT MARGIN ON OPERATIONS
During the ABA Annual Meeting in Chicago last July, the National Conference of Bar Presidents hosted a panel discussion with several innovative legal service providers and entrepreneurs. The panel examined ways that state and local bar associations could use technology and partner with alternative service providers. Panel participants received polite ovations from the crowd.
But the loudest and longest ovation came during the question-and-answer portion. David Miranda, president of the New York State Bar Association, called out the panelists for not providing enough free services and for advocating changes to ethics rules on the unauthorized practice of law.
“You talk about the law like it’s a business,” Miranda said. “It’s not. It’s a profession.”
To Baxter, that’s the exact attitude that’s holding back the legal profession.
“It’s true that law was not intended to be a business and that it was set up as a profession,” says Baxter. “But it’s also true that if you start a business today, it would be unthinkable that you’d do it as a law firm. There’s no way you could get away with having no concern for costs, profits or revenue margins.”
Pam Woldow, a principal and general counsel of consulting firm Edge International, notes that most law firms have tracked profitability for years. “That information hasn’t been shared with the partners, though, for a variety of reasons,” says Woldow, pointing out that this information could lead to dissension among partners. “The question is: How do we use this info? That’s trickier, and a majority of firms don’t know.”
The profit-margin-on-operations metric could go a long way toward shedding light on nonprofitable practices and matters, as well as giving firms a better idea of what kinds of cases or matters they should be taking on.
PMO is simply the partner profit pool divided by firm revenue, presented as a percentage. In our example firm, this is $36 million and 36 percent, close to the average for the Am Law 100.

“The question is: How do we use this info? That’s trickier, and a majority of firms don’t know.” — Pam Woldow. Photograph by Len Irish.
The PMO is useful as a diagnostic for a variety of insights into a firm’s operations. It provides insight into the impact of unproductive work. For our hypothetical firm, it costs $8 million to generate $12.5 million of revenue ($64 million in expenses for $100 million in revenue), of which $4.5 million is partner income. If we are in a situation where we must write off $12.5 million as unbillable—say a litigation that was contingent, a client that failed or a deal that didn’t close—we still spent the money to generate those lost billable hours.
Indeed, 64 percent of billable value is already spent by the time the bill is presented. It isn’t just profit that is forgone in the write-off, but a profit reduction of $8 million, which takes $22.2 million in revenue ($8 million in partner draws being 36 percent of necessary revenue) from other cases to give partners what they expect to receive by year-end.
Profit margin on operations provides insight into income volatility for partners. Every percentage point of PMO is precious; and the lower it goes, the more brittle the firm’s position becomes. Swings in profits for the partners can be greater the lower the firm’s PMO. If the firm pushes the amount of profits per equity partner upward by having fewer equity stakeholders, that will subject these partners to the potential of even greater swings in income year to year. Introduce the guaranteed-income feature to a few partners in a low-PMO firm, and the impact of a bad year on nonguaranteed partners can be severe.
PMO also provides insight into the difficulty of holding on to partners. Simply stated, a partner with a book of business that generates a 40 percent margin is balancing out business elsewhere that is less than the firm’s lower PMO. If the firm has a compensation system that fails to recognize contribution to profit, as contrasted with delivering gross collections, the firm is at serious risk of losing that highly profitable partner.
And if the firm plugs that problem with a compensation guarantee to this profitable partner, then the income swings to other partners in a bad year may drive them away from the firm.
COMPENSATION
Profit per equity partner (shortened to PPP) has become the U.S. News & World Report ranking of lawyer metrics: It’s a number that is readily available, thanks to American Lawyer; eagerly followed by BigLaw partners seeking a yardstick for their firm’s financial rewards; and consistently derided by consultants and fiscal analysts, who find it to be misleading—and possibly detrimental to a firm’s stability.
Tim Corcoran, principal at Corcoran Consulting Group, says PPP is an “imprecise indicator of overall fiscal health that can be impacted and influenced by so many different factors.” Baxter, meanwhile, believes firms should de-emphasize their focus on PPP, noting that “no other business keeps track of its performance based on how much it pays its people.”
Baxter, Corcoran, Woldow and others, including Jordan Furlong of Edge International, believe law firms should be more concerned with profitability metrics.
“One of the most important things law firms should be measuring is profitability at the firm level—as well as by industry or practice group—rather than at the individual level,” Furlong says. “I wish lawyers would measure client profitability and determine who are their best clients. Lawyers will look at the bills and see how much they were paid, but the follow-up is how much did you spend?”
But PPP can have value if it is applied as one of several metrics together. Alone, an increasing PPP may be engineered by simply cutting partners faster than the rate of decline in the firm’s profit pool. Introducing other metrics can restrict such gamesmanship. Let’s use just two additional metrics.

PPP is an “imprecise indicator of overall fiscal health that can be impacted and influenced by so many different factors.” — Tim Corcoran. Photograph by Len Irish.
The first is the median compensation level. This is the midpoint at which half the partners make more and half the partners make less. The second is the compensation-spread multiple from the lowest- to the highest-paid partner in the firm. (This is even more useful if accompanied by the actual numbers for compensation, but that isn’t essential.)
If you track these numbers over the course of several years, you can get a good idea of the overall health of the firm by comparing those numbers to the related profit per equity partner. If the median is moving closer to PPP, then all the partners may be benefiting. If not, partners at the top are gaining more.
Lawyers should also determine whether the median compensation level is increasing or decreasing as reported PPP rises, and whether the compensation spread is rising, holding steady or falling. If the PPP is rising, the median point falling and the compensation spread widening, the firm may be headed for challenging times.
Even then, Baxter cautions that lawyers should not look at compensation spread in a vacuum.
What it means depends on the nature of the partnership, he says. “In some firms, there is a wide array of people who contribute to the firm, and you’d expect a wider range of pay. It’s never meant much to me if it’s 10-to-1 at one firm and 4-to-1 at another. You need to know more about how the firm is structured and how it makes its distributions.”
All of these tools, and quite a few more, can be easily applied with readily available information. At a minimum, they should be used by management/leadership to generate a more detailed awareness of how the firm is performing at present, and especially over time. They should definitely be shared with the executive committee so that healthy discussion can be had about actions to take when unacceptable results or trends are made evident and there is still time to make corrections.
If the firm really is a partnership, all partners should have this information as well.
To what extent the exercise of politics and power in a law firm would restrict or deny this simple information to partners is not for this article to address, other than to suggest to a partner that if you don’t get it without putting yourself at risk of disapproval or discipline, can you really afford to stay?
This article originally appeared in the January 2016 issue of the ABA Journal with this headline: “Killer Calculations: Dewey mean it? Metrics can tell the tale of a firm’s fate.”
Correction
Print and initial online versions of “Killer Calculations,” January, should have referred to Michael McKenney as the head of investment finance for Citi Private Bank’s Law Firm Group.The Journal regrets the error.
Edwin B. Reeser is a business lawyer in Pasadena, California. He has served on the executive committees and as an office managing partner of firms ranging in size from 25 to more than 800 lawyers. Victor Li is a legal affairs writer for the ABA Journal.